Active Moving Averages
The Active Moving Average is part of the class of Exponential Moving Averages. The Active Moving Average does differs from standard Moving Averages (MA) with respect to the speed with which the Active MA converges to the historical signal. Stated differently the Active MA is much closer (i.e. it is more active) to the historical data than all other MAs. To explain how the computation is done we should use notations like Z-Transform and introduce concepts of Digital Signal Processing giving too much complexity to this simple presentation. What is important to note is that this MA is quadratic in nature and that’s why it converges more rapidly to the historical signal than the classical MAs.
This is an example showing how the Active MA is always closer and quicker than the corresponding Exponential Moving Average (the blue line is the Active and the red is a classical Exponential MA, same period for both):
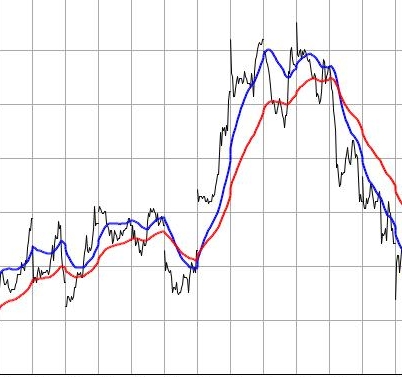
The example is drawn from an intraday stock chart. Note also that all properties of Moving Averages hold true also for the Active MA, so this algorithm introduces the same lag as an Exponential MA and is a low-pass filter. An issue that holds true only for the Active MA is that the “bootstrap” of the algorithm introduces more whipsaws than other algorithms and can thus be used only if there is enough historical data.
Since the Active Moving Average responds quickly we can construct a simple Technical Analysis indicator the is the difference between the Active Moving Average and another moving average with the same period. The result will be a zero lag MACD like indicator that can be effectively used in trading. The example below has been computed on the EURUSD cross weekly:
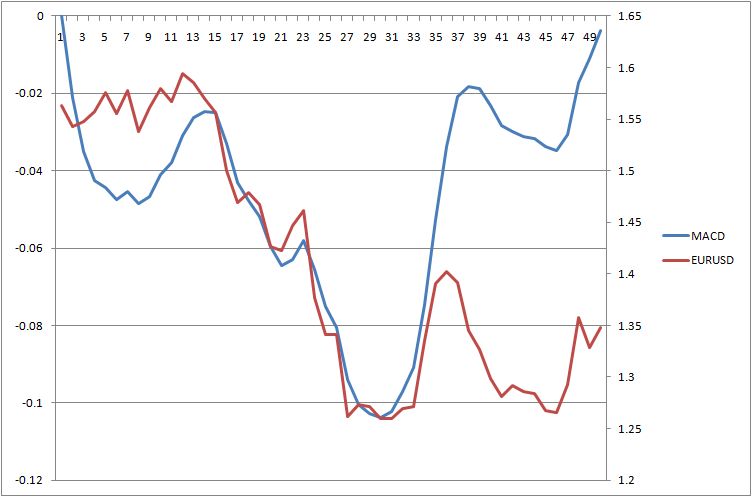
The example shows clearly a divergence buy circa bucket 45 and notice how the indicator slope turns positive or negative very early in the developing trend and the very few whipsaws (actually one) that would have put an eventual trader against the market in all 50 weeks.