Principal Component Analysis, Singular Spectral Analysis
Decomposition is a statistical technique that analyzes time-series by decomposing them in their basic constituents. The method of decomposition varies depending upon the technique and all are functionally equivalent to a Fourier transform that basically sees a time-series as a sum of sines and cosines. In this case the basis functions are not defined as mathematical functions but are based on the data itself. The purpose of decomposition is to gain insight into the individual components of the time-series and is a basic analysis tool.
Principal Component Analysis
Principal Component Analysis (PCA) is an orthogonal linear transformation that transforms the original time-series by projecting it to a new set of coordinates in order of decreasing variance. The transformation is by definition an optimum transformation in the least squares sense. The method essentially consists of computing the eigenvalues of the covariance matrix of the input observations, rearranging a subset of the eigenvectors in order of decreasing energy and finally projecting onto this eigenvector subset.
Singular Spectral Analysis
Singular Spectral Analysis (SSA) is another method of decomposition of time-series into the sum of a small number of independent components. The methodology consists basically of two steps: singular value decomposition of a Hankelized matrix computed on input data and reconstruction by grouping and diagonal averaging. The Singular Spectral Analysis of the EUR/USD from April 2006 to April 2009 is shown in the following:
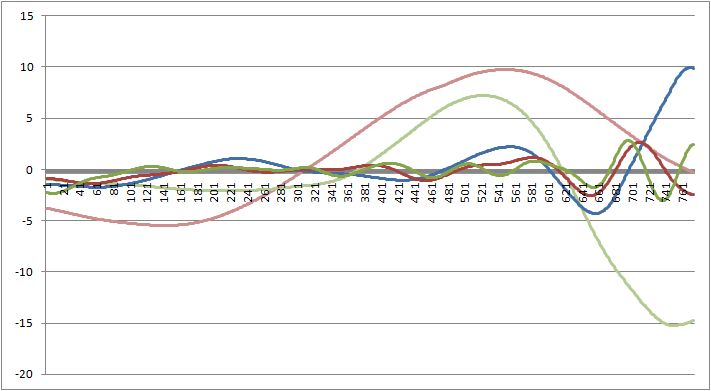
from the image it is clear the separation of the different “spectral” components the method proposes. These components can be used to reconstruct the original signal cutting meaningless power from the lower spectral bands (simply setting them to zero).
Singular Spectrum
The singular spectrum is the vector of singular values of the Hankelized matrix used in Singular Spectral Analysis and represents the energy of each component. The singular spectrum of the same dataset is:
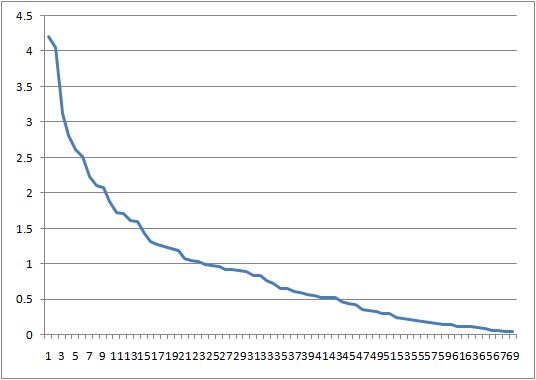
This is actually the logarithm of the Spectrum because of its fast decaying that would render non clearly visible the image.
Empirical Mode Decomposition
Empirical Mode Decomposition (EMD) is a nonlinear method proposed by N.E. Huang used to decompose functions as sums of zero-mean components. The methodology consists basically of computing an upper and lower spline envelope of the time-series and extracting the average of this envelope up to when the residuals are random noise or stopping criterion is met. The Empirical Mode Decomposition of the same dataset is:
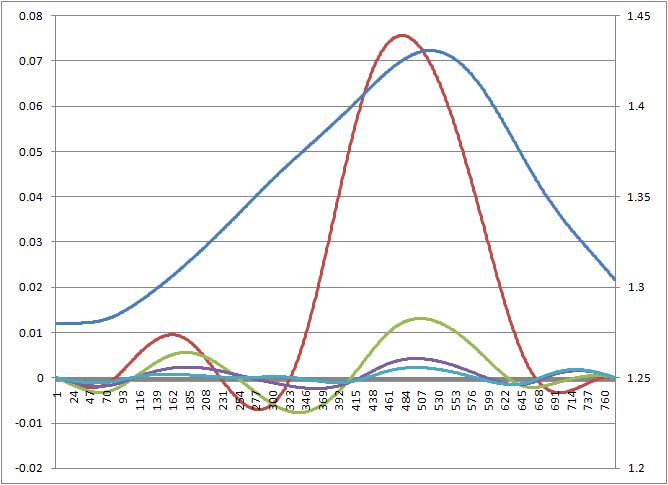
where the different wave composition with respect to Singular Spectral Analysis is clearly visible.
You can download an example Excel worksheet with Singular Spectral Analysis and Empirical Mode Decomposition of the EUR/USD.